
Synergy Nano Logging Function – Importing to Excel for Graphing
Manual graphing:
In the past, people used to use pen paper and a stopwatch to do manual graphing. Strip charts and circular chart recorders have come and are now gone. Separate logging gear is often expensive and cumbersome.
Now, when there is a need to graph simple logged temperature data, the Synergy Nano will help streamline the process.
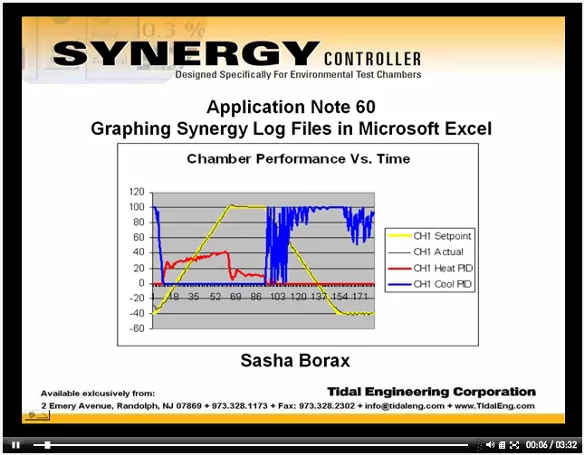
Here is a procedure by Sasha Borax on how to quickly produce graphical results in Excel from data logged by the Synergy Nano. Titles. selection of data to be logged and logging intervals is easy.
Graphing data from Synergy Logging function to Excel
Ask any questions.
We are here to help.